Disclosure: This post may contain affiliate links. I earn a small commission of product sales to keep this website going.
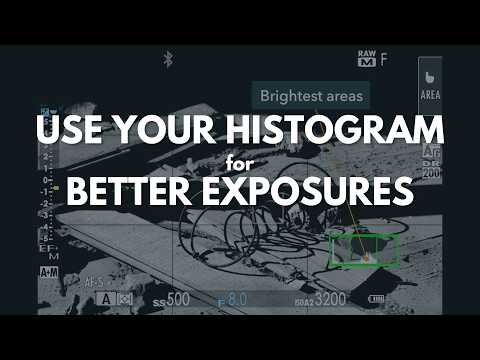
Use the histogram for perfectly exposed photography every time
Mirrorless cameras have so many advantages, and the in-camera histogram is one of my favorites. You won’t have to guess how your camera is metering before you take the shot, and you won’t have to look at the photo after the shot to determine how it was exposed. Interpret the histogram during the composition, press the shutter, and compose the next photo!
Is it cheating to use the camera’s histogram? Absolutely not – the histogram is a tool that we should use if it’s available. Technology furthering art. The histogram used with the Zone System is a lethal combination for nailing exposure.
Traditional metering isn’t always ideal
Most documentary-style photographers are frequently in and out of different lighting conditions. Metering each scene and locking in a manual exposure can take time you don’t have. Letting the camera meter the scene automatically…God knows what’ll happen if you leave it to the camera.
Knowing how to use the in-camera histogram as a meter provides a much more accurate way to see what’s happening with your exposure. After switching to mirrorless systems, I prefer the histogram over the traditional meter.
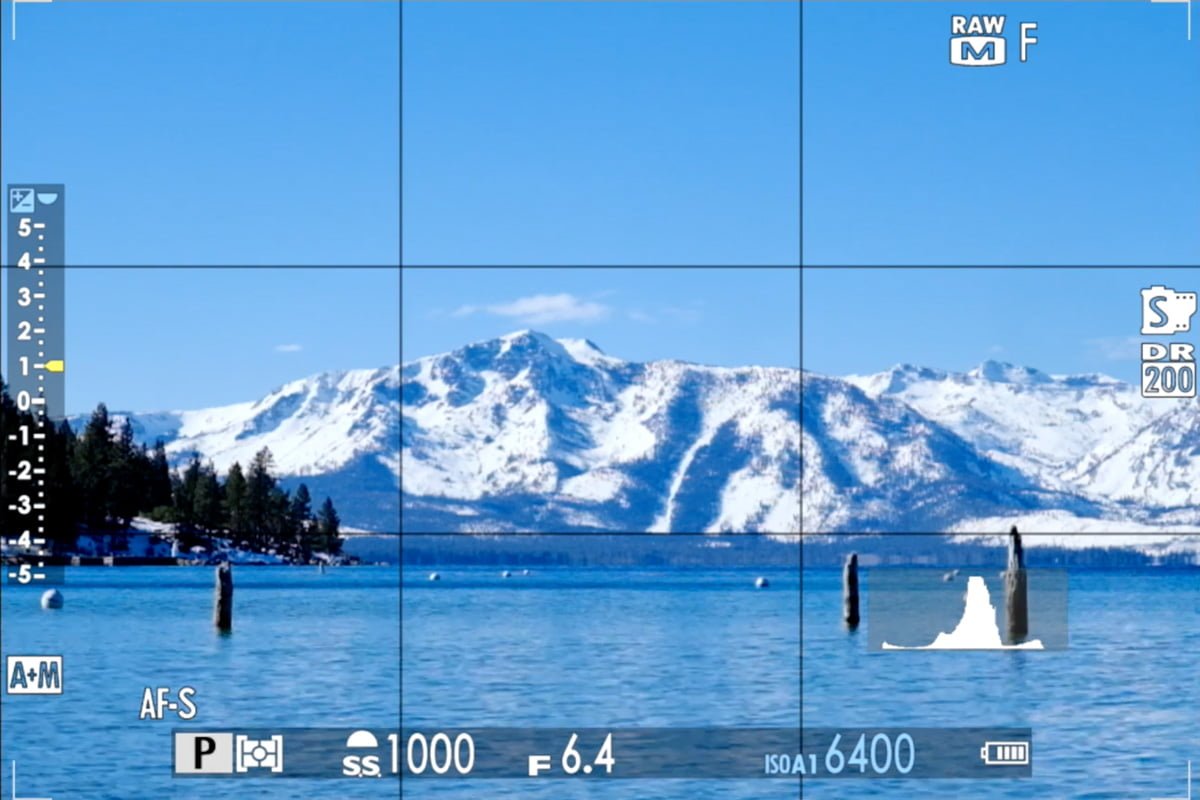
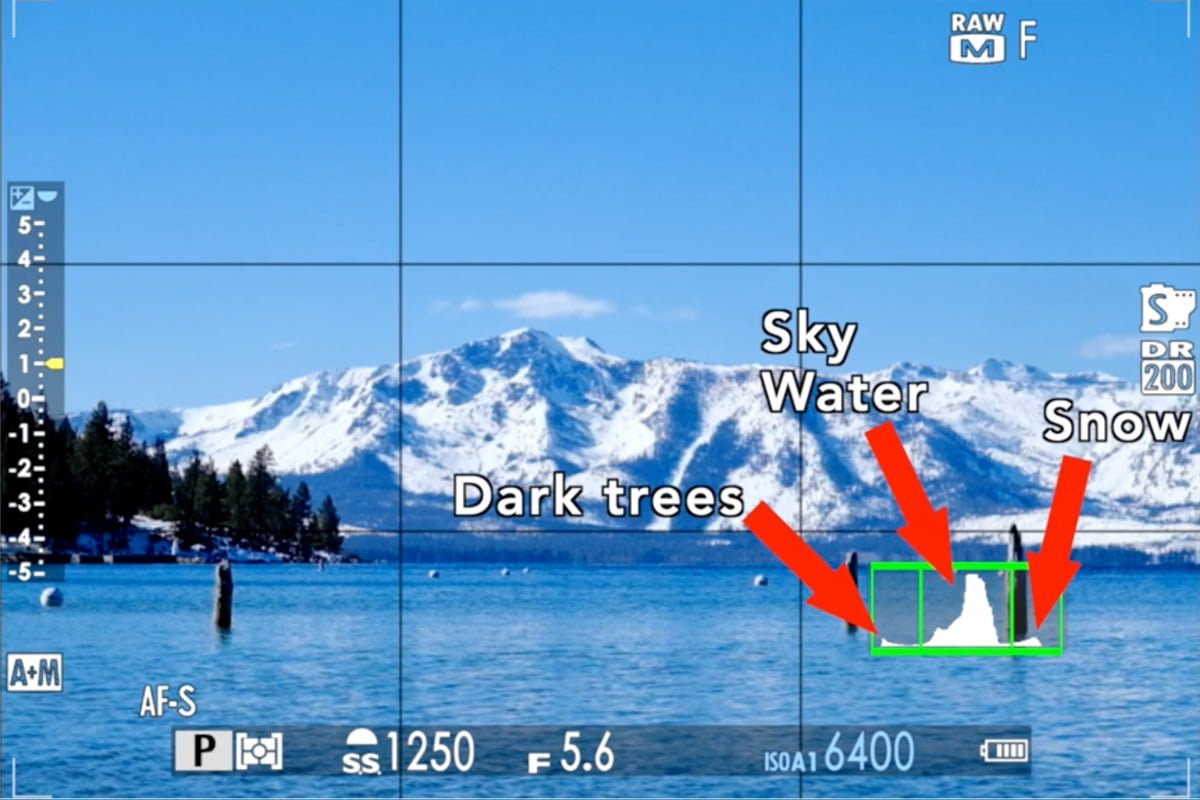
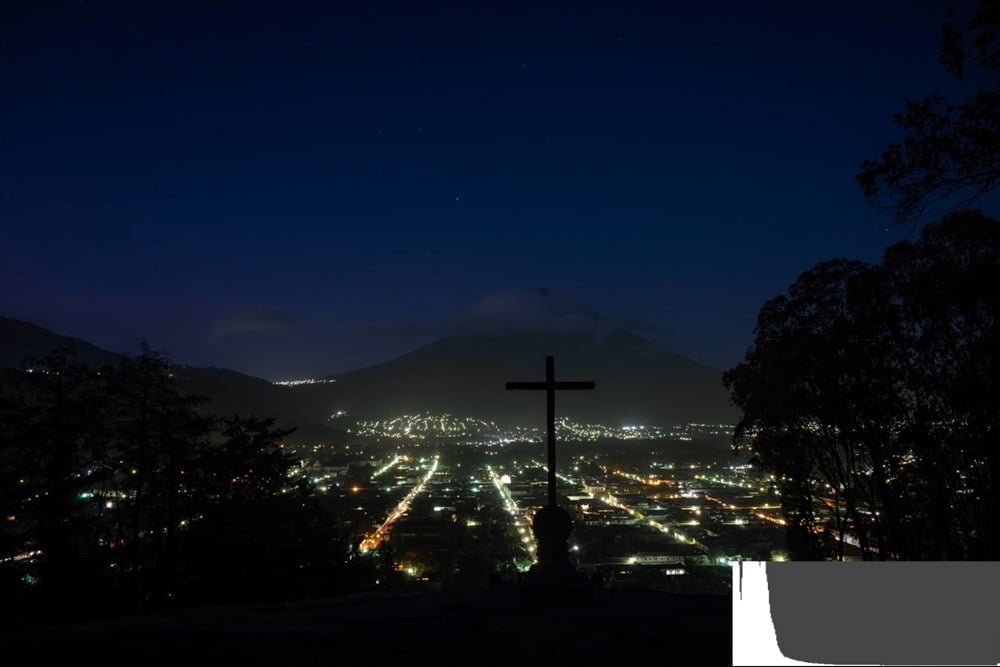
The photo below is a perfect example of when you could use the histogram in a scene with dark tones, midtones, and bright tones – we’ll dissect this later. I just needed to glance down at the lower right corner of my EVF to the histogram, and I know what the exposure looks like.
With practice, you can look at a scene and know what the histogram should look like, and vice-versa.
The viewfinder lies
You can’t judge your exposure based on the brightness of your viewfinder or LCD. This isn’t the “truth data.”
Viewfinder & LCD brightness is subjective. It can be manually adjusted by the photographer. It can be automatically adjusted by the camera based on ambient lighting. You have to use the histogram to truly know how bright the image will be.
The in-camera histogram is based on the JPEG, not the RAW
“I don’t even have JPEG enabled. I’m shooting RAW only.”
Yes, but the camera still creates a JPEG preview even if you’re only shooting RAW. The camera’s histogram is based on the JPEG preview, not the RAW output. This is one of the most important things to remember when learning how to use the camera’s histogram.
You may think you’re blowing highlights or clipping shadows – and compensate for that – when, in reality, you’re preserving both.
There are ways to view a histogram that’s closer to what the RAW file will look like (though still not perfect), but it’s a better option if you’re only recording the RAW file format:
- Fujifilm X/GFX: Turn Preview Pic Effect Off or Natural Live View On
- Nikon Z: Set Picture Control to Flat
- Sony a: Set Creative Style to Neutral
- Canon EOS R: Set Picture Style to Neutral
How to read the camera’s histogram
Reading a histogram is easy once you understand the basic concept. And knowing the basic concept is all you need to understand about it.
Basic histogram construction
The histogram is a graphical representation of the brightness of all the pixels in your composition. In total non-technical terms:
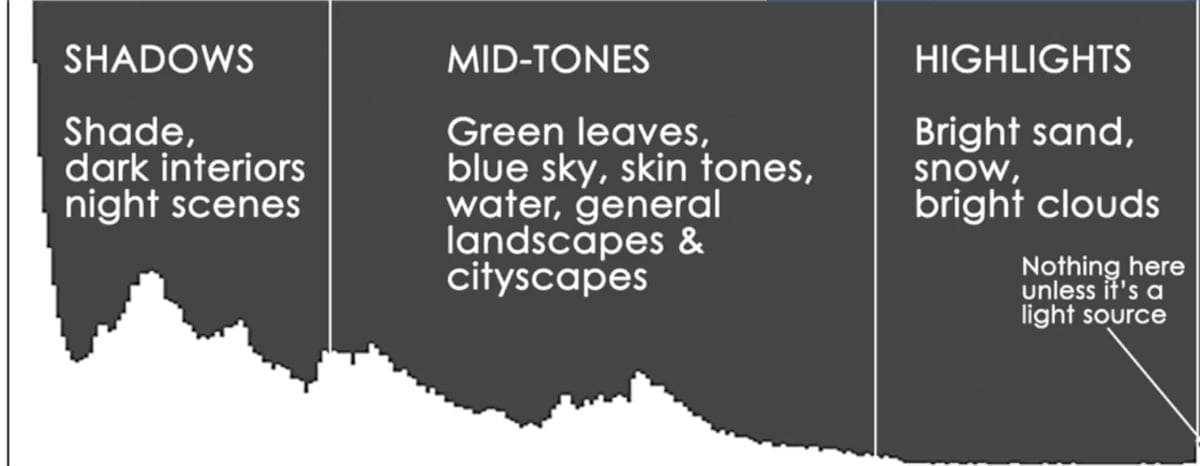
- The left side shows the amount of dark pixels, and the right side shows the amount of bright pixels.
- The graph’s height shows how much of that brightness is found within the image.
If the mass of your graph is in the middle, you have an image with even middle tones.
Histogram interpretation example
Returning to our first example and splitting the histogram into three zones, we can interpret the graph from left to right.
- A small area of dark trees on the left side of the scene accounts for a very small percentage of the overall photo. There will be a very small “bump” in the shadow area of the histogram.
- Most of the scene is comprised of blue sky and blue water. Accordingly, most of the histogram is in the middle.
- A small portion of the scene is made up of bright snow, which is almost white. We see a small portion of the histogram in the “highlight” area.
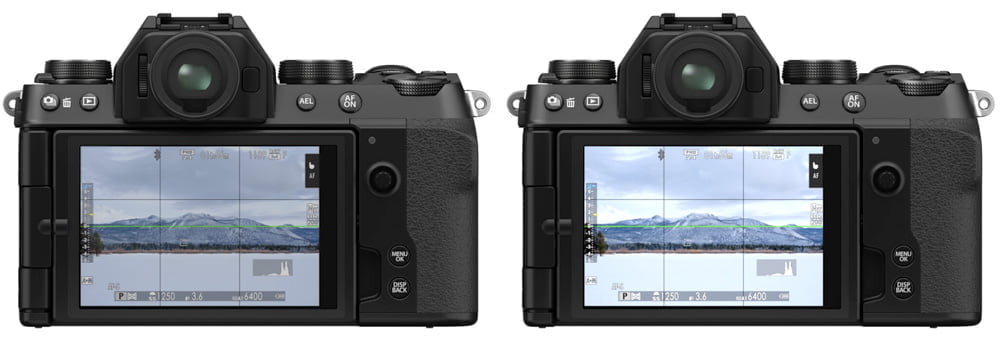
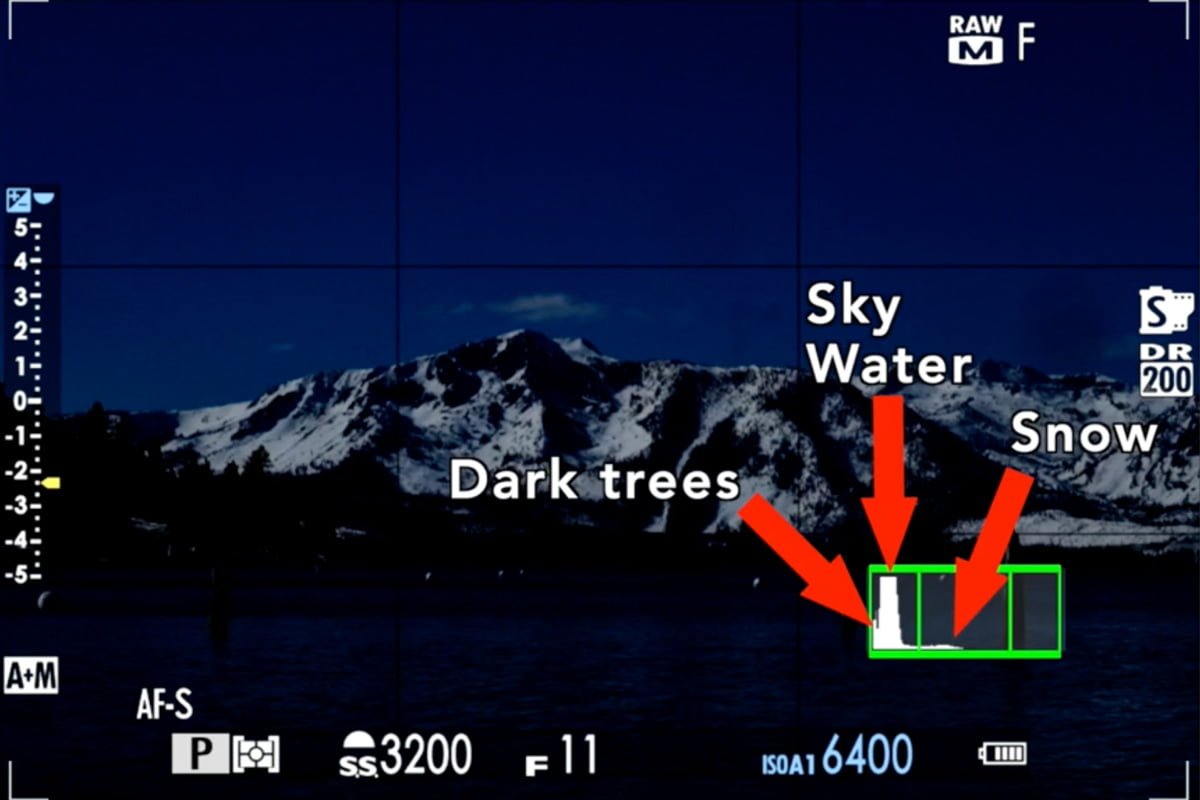
If our image is underexposed – too dark – we see that the bulk of the histogram is in the shadow area. But this is all sky – it should be in the middle! The snow, which should be white, comes down to the gray area of the histogram. We don’t want gray snow!
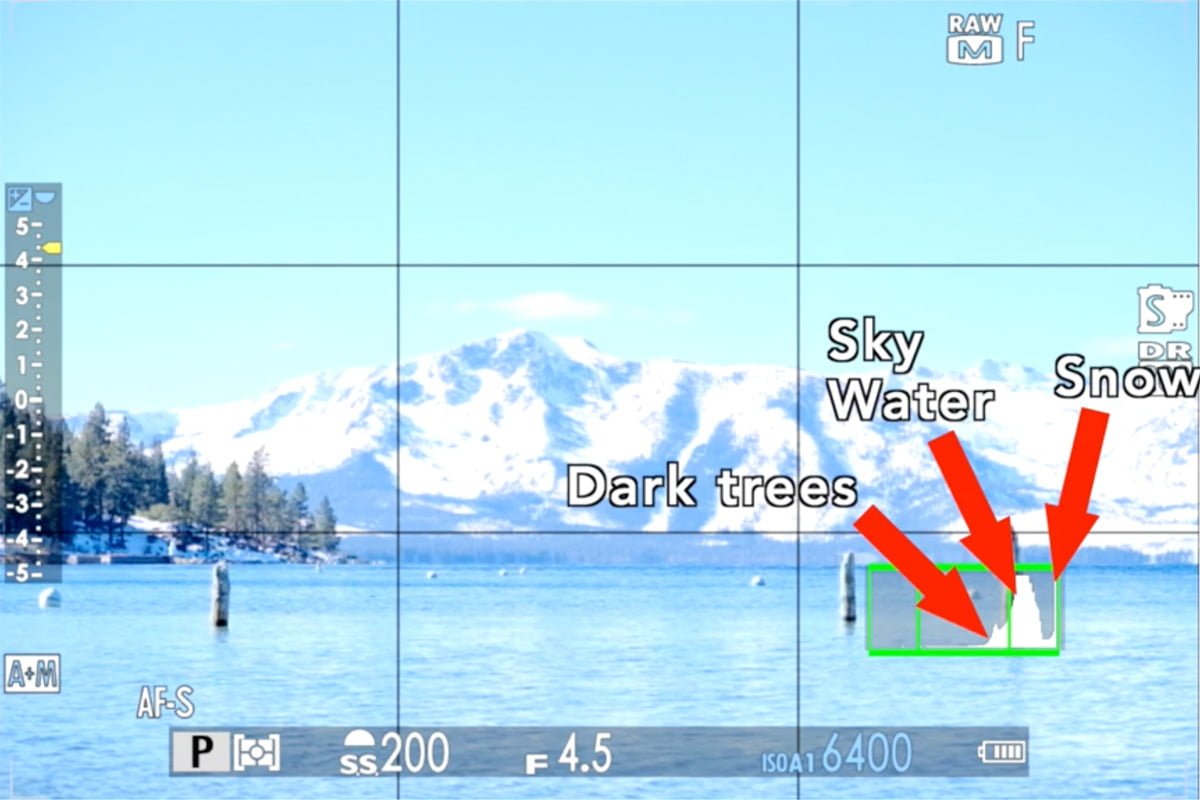
When our image is overexposed – too bright – now that sky is approaching the highlight area. Blue water and blue sky will lose their color if it’s in that highlight area. Note the trees, which are supposed to be in the shade, also almost come up to the highlights.
If you have a very bright scene, the bulk of the histogram should be on the right. Some pixels could be pure white.
If you have a very dark scene, the bulk of the histogram should be on the left. Some pixels could be black.
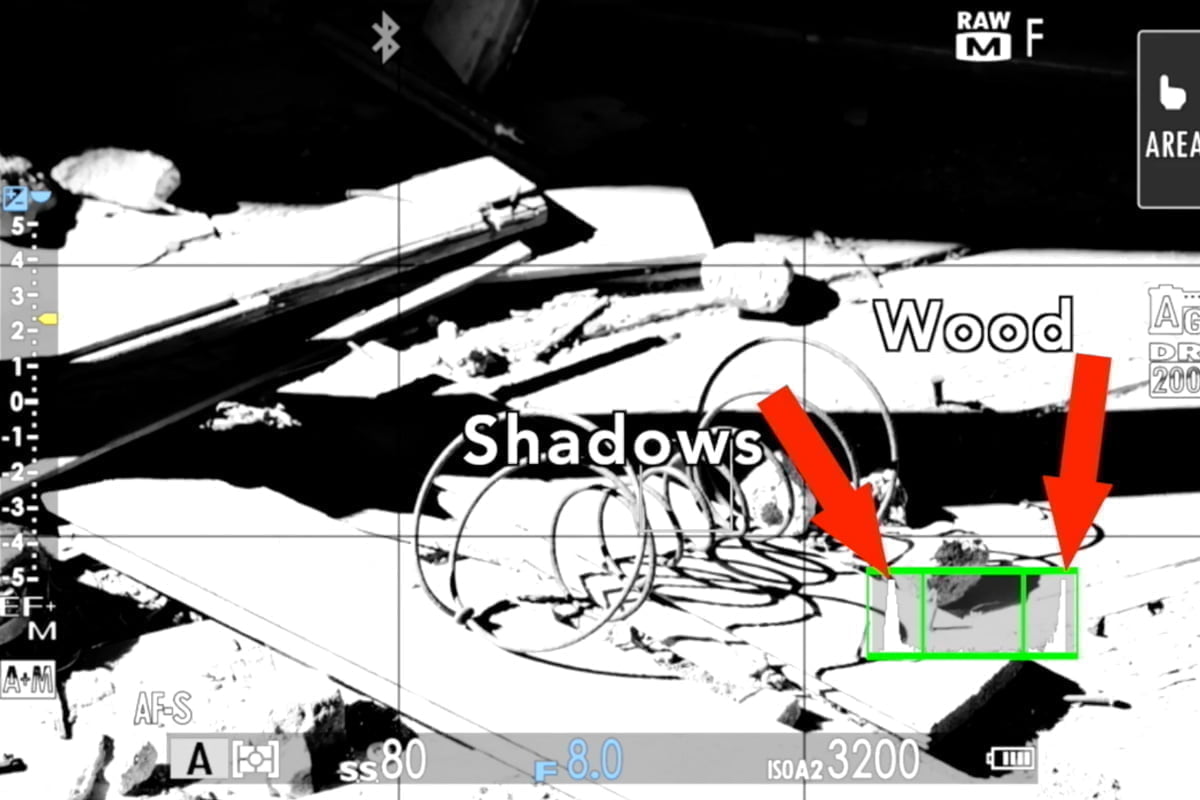
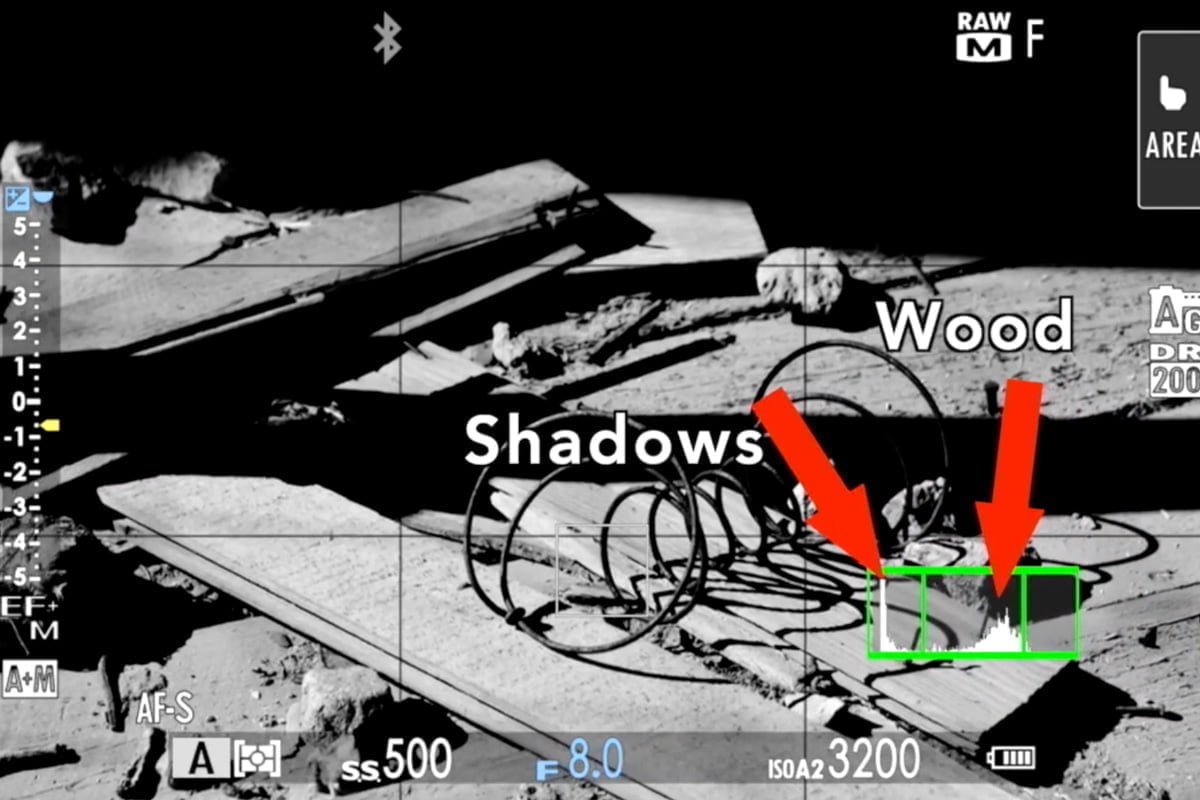
The histogram in high-contrast scenes
In a high-contrast scene, you usually have to choose which area to expose for.
In the example below, the wood is in the highlights and the shadows are in the, well, shadows. The wood should be in the mid-tones though, so I pull the exposure down to put the bright areas (the wood) in the middle. That places the shadow areas further into black, which is fine because I think seeing the detail in the brighter areas of the wood is more important.
How to turn on your camera’s histogram
Here’s how to enable the histogram in popular mirrorless cameras.
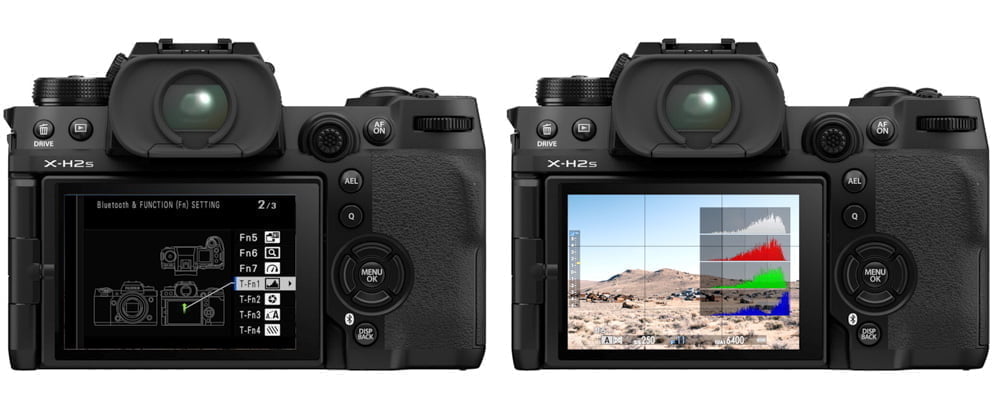
Enabling the histogram in Fujifilm X/GFX cameras
Turning on the histogram in Fujifilm X/GFX mirrorless cameras is easy.
- In the Menu, go to the Settings (wrench) icon
- Enter SCREEN SET-UP
- Scroll to DISP. CUSTOM SETTING and enter
- Ensure that HISTOGRAM is checked
The histogram will be displayed in the lower right of the screen until the shutter button is half-pressed, then it will disappear. The histogram cannot be enabled for the EVF and LCD individually.
You also have a larger histogram which you can enable by assigning a custom function control to “Histogram.” This is not available in all Fujifilm cameras.
Enabling the histogram in Nikon Z cameras
Nikon Z cameras also have minor variations in the setup & displays, but you can view the histogram by pressing the DISP button until you see the overlay with the histogram. Some cameras allow you to customize the overlays for both the LCD and the Monitor differently:
- Press Menu and go to Custom Settings > d (Shooting/display)
- Find Custom Monitor (or Viewfinder) Shooting Display
- Put a checkmark next to the items you want to see for each display
You can also view the luma & RGB histograms for images in Playback:
- Press Menu and go to Playback Menu
- Go to Playback display options
- Put a checkmark next to RGB histogram
- The RGB histogram will now be available when pressing the DISP button in Playback mode
Enabling the histogram in Sony Ax cameras
The Sony Alpha camera menus are slightly different but more or less the same from camera to camera.
- In the Camera menu, go to DISP. Button (usually Camera 2 menu, page 6ish)
- Select Monitor (LCD screen) and enable Histogram
- Select Enter to save the settings
- Go back to the previous screen and select Finder (EVF) and select Histogram
- Select Enter to save the settings
Enabling the histogram in Canon EOS R cameras
Enabling the histogram in Canon EOS R mirrorless cameras is very similar to doing so in Nikon Z cameras, you press the INFO button until you see the display with the histogram overlay.
You can further customize what’s displayed for your different INFO screens:
- In the main menu, go to the wrench icon pages and look for Shooting Info Disp.
- Enter Screen Info Settings
- Select the options you want to see for the different pages
There is no perfect histogram
There are numerous charts and infographics on the Internet, like on Pinterest, with examples showing what the “perfect” or “best” histogram is. But these are never accompanied by actual images to show why.
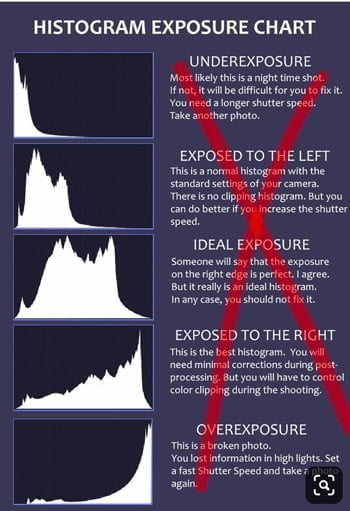
Secret: there is no “best” histogram. The only perfect histogram is the one that is true to both your subject matter and how you want to expose it.
If you want a bright, optimistic image or are taking a picture of a sunny snowscape, of course it will be on the right.
If you’re taking a dark, moody photo in a poorly-lit forest or a night photo, of course it will be biased to the left.
Practice with the histogram
You won’t be able to read this post or watch a YouTube video and be a histogram expert. It’s going to take some practice, which should give you even more reason to get out and shoot! As long as you now understand how to use the camera’s histogram, you’ll be on your way to better exposures!
You can check out a variety of our photography courses for further information about exposure and using the histogram. Use the code “blog20” for 20% off.
Do you have any questions or comments? Please leave them below!
Tom
Tuesday 12th of December 2023
This website and your articles are absolutely fantastic. I'm using fujifilm cameras couple of years and now rediscovering possibilities again.
Thank you so much
John Peltier
Wednesday 13th of December 2023
Oh that's great! I hope you find the answers to a lot of your questions here.
Sophie
Thursday 8th of December 2022
Thank you for your explanations John. Very enlightening. Seeing photo examples with their respective histograms helped a lot!
John Peltier
Thursday 8th of December 2022
You’re welcome, glad it helped!
Job de Lange
Wednesday 29th of December 2021
Thanks John! I totally agree with Lisa's comment. Crystal clear, as always. Just one remark. My Fuji camera (X-T3) has the ability to show different histograms for different colours. Maybe that could be an interesting subject for another article?
John Peltier
Thursday 30th of December 2021
Yes, the RGB histogram. That's varsity-level, but useful in certain situations - I'll definitely add it to my editorial calendar, thanks for the suggestion!
Andy Charnas
Tuesday 26th of October 2021
John, nice article. Very clear. One question: you say "Then move your pointer around the image. All of these programs will show you where on the histogram that part of the image lies." In Lightroom, I don't see this behavior. I have always wished it worked this way, but I don't see any indication in the histogram when I move the pointer over the photo. Is there some way to turn this on in Lightroom?
John Peltier
Thursday 28th of October 2021
Yeah Andy, you kinda have to cheat in Lightroom Classic. You have to go to the Tone Curve module and then use the Targeted Adjustment tool. When you move that over your image it'll show you where on the histogram you are.
Pete Massingham
Tuesday 25th of May 2021
The article is very useful for people wanting to understand a basic idea of exposure control. However, it really does not explain how the Zone System works or even if it can with digital cameras; primarily because the analogue system also took into account contractions and expansions at either end of the goal spectrum. Digitally, you can really only be a bit more careful about which area of the image you are exposing for - unless you can afford a camera with an exposure latitude of about 15 stops. Useful but people are not going to get a similar control that they would with the original Zone System. A useful addition though to technical help and of course technology offers all sorts of routes to adjusting images post exposure.